
Калькулятор вартості пропускної здатності CDN: Трафік, кеш і витрати на оригінал

Оцініть витрати на доставку CDN та вихідні витрати на оригінал, використовуючи перегляди сторінок, розмір сторінки та швидкість попадання кешу в байтах, з прикладами та порадами щодо оптимізації.
Оцінка пропускної здатності CDN та вихідного трафіку
Decimal units: 1 GB = 1,000 MB. Cache hit rate is assumed to apply to bytes transferred, not merely request counts. Both CDN delivery and origin traffic are estimated; free tiers, request charges and compression differences are excluded.
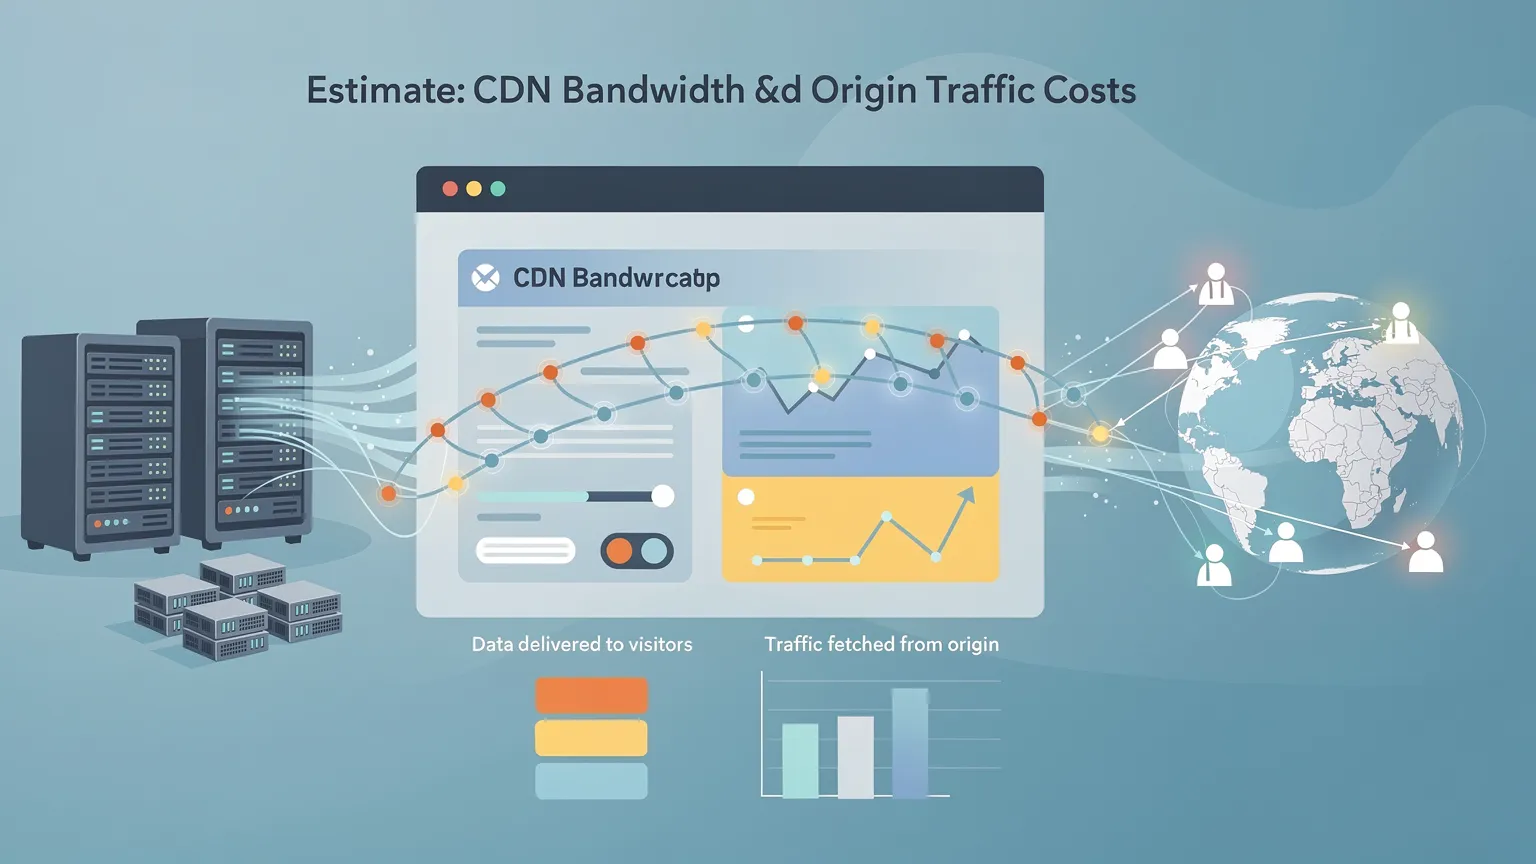
A content delivery network (CDN) can speed up a website by serving cached content closer to visitors. But a CDN bill can include data delivered to visitors, traffic fetched from your origin server, and fixed or request-based charges. The calculator above helps you estimate the first two traffic components using transparent assumptions.
It is a planning tool, not a live quotation. The example prices are hypothetical and expressed in USD.
Як користуватися калькулятором CDN пропускної здатності
- Місячні перегляди сторінок: введіть кількість сторінок, які відвідувачі завантажують у типовий місяць. Використовуйте аналітику або журнали доступу, а не кількість унікальних відвідувачів.
- Середній розмір переданого файлу (MB): оцініть загальну кількість переданих байтів для представлюючого завантаження сторінки, включаючи HTML, зображення, таблиці стилів і JavaScript. Використовуйте панель Network у браузері, щоб виміряти фактичну кількість переданих байтів.
- Удіх кешу CDN (%): введіть оцінений коефіцієнт відповіді з байтами, тобто частину переданих байтів, що обслуговується з кешу. Коефіцієнт відповіді на запит може бути не однаковим.
- Ціна передачі даних CDN (USD/GB): використовуйте ставку доставки, що застосовується до вашої очікуваної аудиторії та провайдера.
- Origin egress price (USD/GB): введіть будь-яку комісію за байти, передані з origin до CDN.
- Other CDN fees (USD/month): add estimated fixed charges, request fees or other known monthly costs not captured elsewhere.
The calculator uses decimal units: 1 GB = 1,000 MB. It assumes every page view transfers the entered average page size.
Формули, що лежать в основі оцінки
CDN delivery (GB/month) = page views × average transferred page size (MB) ÷ 1,000.
Origin transfer (GB/month) = CDN delivery × (1 − cache hit rate ÷ 100).
Monthly estimate = (CDN delivery × CDN rate) + (origin transfer × origin egress rate) + other monthly fees.
The annual figure multiplies the monthly estimate by 12. It assumes unchanged traffic, prices and caching behavior.
Приклад розрахунку: контентний сайт
Suppose a site receives 50,000 page views per month. Each page transfers 2 MB, the CDN serves 80% of bytes from cache, CDN delivery costs $0.08/GB, and origin egress costs $0.09/GB.
| Компонент | Розрахунок | Результат |
|---|---|---|
| CDN delivery | 50,000 × 2 ÷ 1,000 | 100 GB/month |
| Origin transfer | 100 × (1 − 0.80) | 20 GB/month |
| CDN delivery cost | 100 × $0.08 | $8.00 |
| Origin egress cost | 20 × $0.09 | $1.80 |
| Other fees | Assumed $0 | $0.00 |
| Monthly estimate | $8.00 + $1.80 | $9.80 |
| Annual estimate | $9.80 × 12 | $117.60 |
These are illustrative prices, not verified rates for any CDN provider.
Що змінюється, коли покращується кеш-ефективність?
Keep the same 100 GB monthly CDN delivery and rates, but compare three byte hit ratios:
| Byte cache hit rate | Origin transfer | Origin egress cost | Total monthly estimate |
|---|---|---|---|
| 50% | 50 GB | $4.50 | $12.50 |
| 80% | 20 GB | $1.80 | $9.80 |
| 95% | 5 GB | $0.45 | $8.45 |
In this simplified model, a higher cache hit ratio reduces origin traffic, but it does not reduce the 100 GB delivered to visitors. CDN delivery remains $8.00 in every row.
Actual bills depend on your provider's traffic accounting, region, cache-fill policies and other charges.
Як точно виміряти розмір сторінки
Open your site in a browser, launch Developer Tools, and select the Network panel. Disable browser caching for a cold-load test, reload a representative page and inspect transferred bytes rather than uncompressed resource sizes.
Repeat the measurement for a homepage, article page and image-heavy page. Weight the average by real traffic if possible. A homepage with 1 MB of transferred assets does not represent a product gallery transferring 8 MB.
Important distinction: browser caching and CDN caching are different. Browser caching may prevent a repeat request from reaching the CDN at all, while CDN caching affects whether the CDN must fetch an object from the origin.
For a more accurate estimate, compare browser measurements with the CDN's reported monthly delivery and origin-fetch metrics.
Приклад: зростання трафіки та великі зображення
A site serving 200,000 page views monthly at 3 MB per page transfers an estimated 600 GB/month. At an 85% byte hit rate, origin transfer is 90 GB/month.
At the same illustrative rates of $0.08/GB for CDN delivery and $0.09/GB for origin egress:
- CDN delivery: 600 × $0.08 = $48.00.
- Origin egress: 90 × $0.09 = $8.10.
- Monthly estimate before other fees: $56.10.
If image optimization reduces the transferred page size from 3 MB to 2 MB while other assumptions stay constant, estimated CDN delivery falls to 400 GB, origin transfer to 60 GB, and monthly cost to $37.40.
This example illustrates why reducing transferred bytes can lower both CDN delivery and origin traffic in the model.
Поширені помилки та як їх виправити
| Помилка | Чому це важливо | Кращий підхід |
|---|---|---|
| Використання унікальних відвідувачів замість переглявів сторінок | Один відвідувач може завантажити багато сторінок | Використовуйте виміряні місячні перегляди сторінок |
| Використання розміру ресурсу без розпакування | Трафіка мережі може бути меншою через стиснення | Вимірюйте передані байти |
| Вважати коефіцієнт відповіді на запит коефіцієнтом відповіді з байтами | Великі файли та малі запити впливають на загальні показники по-різному | Використовуйте метрику, засновану на байтах, якщо доступна |
| Припускати 100% кешабельності | Динамічний HTML, аутентифіковані сторінки та персоналізований контент можуть обходити кеш | Перегляньте заголовки кешу та фактичні коефіцієнти відповідей |
| Нерозраховувати вихідний трафік | Origin provider may charge for cache fills | Check both providers' billing terms |
| Припускати, що весь трафік CDN має одну ціну | Регіони та рівні обслуговування можуть відрізнятися | Використовуйте зважену ставку або розрахуйте регіони окремо |
| Забувати про витрати за запити та додаткові внески | Some plans charge for operations or add-ons | Enter an estimated amount under other fees |

Як покращити кешування без порушення сайту
Cache static assets appropriately. Versioned CSS, JavaScript, fonts and images can often use longer cache lifetimes. Confirm the CDN respects your origin's cache-control headers.
Be careful with personalized pages. Do not publicly cache user-specific account pages, private data, carts or checkout responses. Verify cache keys, cookies and bypass rules.
Optimize images and assets. Compress images, use appropriate dimensions and formats, and avoid sending unnecessarily large files to mobile devices.
Inspect real cache metrics. Review hit and miss rates, origin-fetch volume, geographic traffic and unexpected spikes. A high request hit rate can still conceal expensive misses for large objects.
Test after configuration changes. Confirm that users receive fresh content when required and that authenticated sessions remain isolated.
Frequently asked questions
Does a CDN reduce total data delivered to visitors?
Caching alone does not necessarily reduce the bytes sent to visitors. It mainly changes where those bytes are served from. Compression, image optimization and browser caching can reduce transferred bytes.
Does an 80% cache hit rate mean 80% less CDN cost?
Not necessarily. In this calculator, an 80% byte hit rate reduces estimated origin transfer by 80%, while CDN delivery is still charged on the full delivered volume.
Is origin traffic always billed?
No. The answer depends on your origin provider, CDN arrangement, included allowances and any special interconnection agreements. Enter zero only if your actual contract supports that assumption.
Can I calculate the cost of video streaming?
You can estimate transferred bytes, but video delivery may have different pricing, traffic patterns and service fees. Use the provider's specific video pricing model for a reliable quote.
Are the calculator's prices current?
No. Replace the illustrative rates with current prices from your CDN and origin providers. The calculator does not retrieve live tariffs.
This educational estimate uses simplified traffic and billing assumptions. Check your CDN and origin invoices before making infrastructure decisions.