
Wydajność WordPress w 2026: Jak naprawić wolny serwis bez dodawania kolejnych wtyczek

Praktyczny, krok po kroku przewodnik wydajności WordPress z diagnostyką DevTools, przykładami PHP i JavaScript, sprawdzaniem pamięci podręcznej, Core Web Vitals i oceną hostingu.
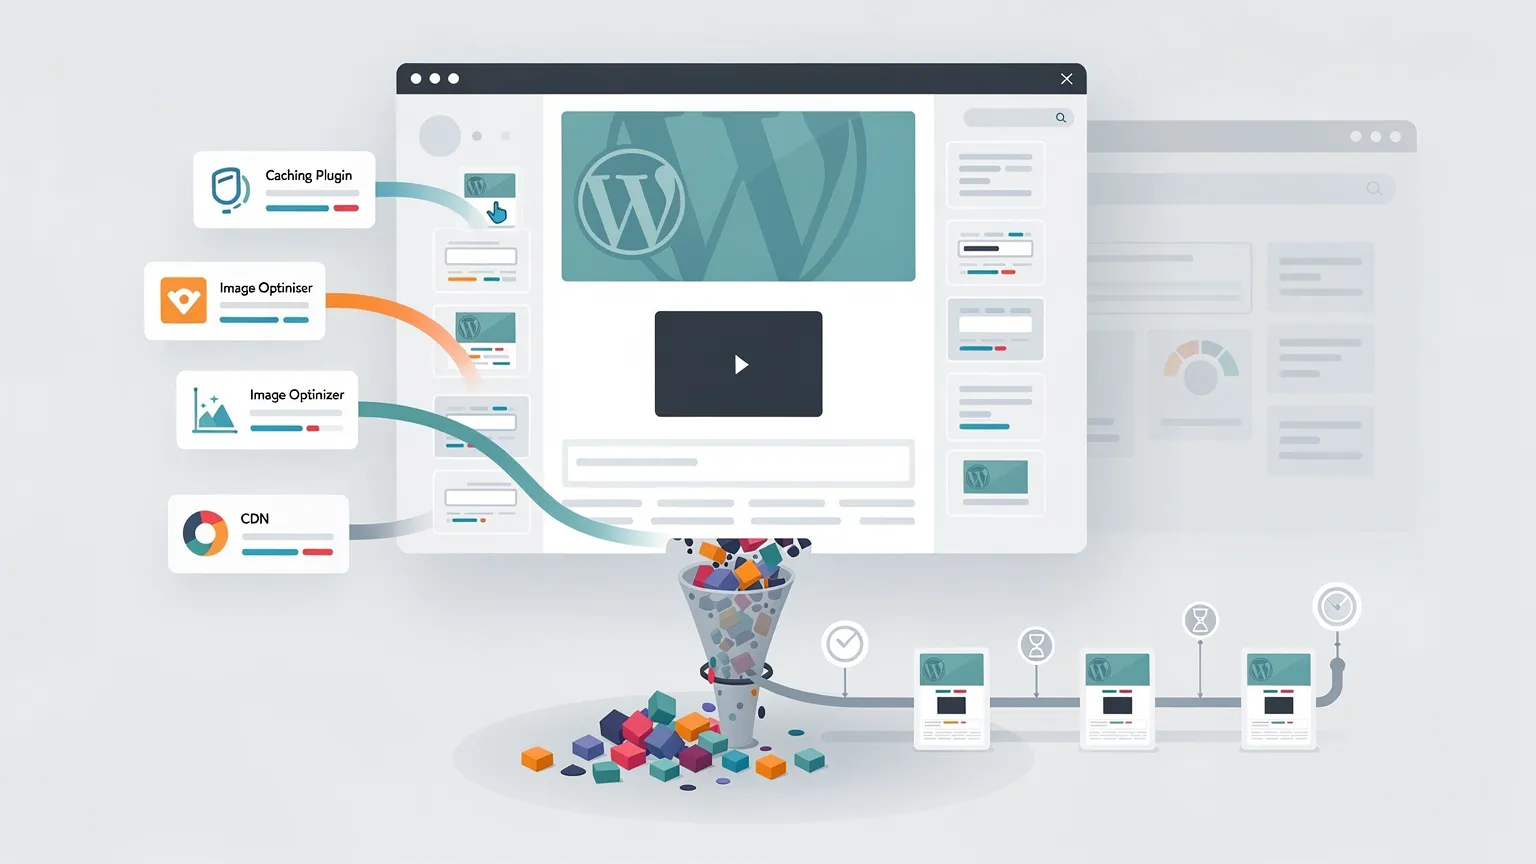
A WordPress site can have a caching plugin, an image optimizer and a CDN—and still feel slow. The problem is often that none of those tools addresses the actual bottleneck.
This guide uses a reproducible example: a WordPress publication with a large hero image, a form plugin loading assets everywhere, an embedded video, and slow uncached article requests. We will measure each issue, make a targeted change and verify that it helped. The example numbers are illustrative, not results from a live benchmark.
You do not need to install another performance plugin to follow most of the steps. You do need access to the WordPress dashboard, browser developer tools, and, for some fixes, a child theme or a small site-specific plugin.
Before you begin: Back up your site and database. Test PHP changes on staging. Do not paste snippets into a parent theme that will be overwritten on update. Where hosting, theme or plugin behavior differs, verify the actual output.
1. Start with evidence, not a performance score
Suppose your article page feels slow on mobile. PageSpeed Insights reports:
| Metric | Illustrative baseline | Good threshold |
|---|---|---|
| Largest Contentful Paint (LCP) | 4.6 s | ≤ 2.5 s |
| Interaction to Next Paint (INP) | 310 ms | ≤ 200 ms |
| Cumulative Layout Shift (CLS) | 0.18 | ≤ 0.1 |
These are example values, not measurements from CeiKay or any other site. Google's Core Web Vitals thresholds are evaluated at the 75th percentile of page visits. PageSpeed Insights may show field data for the URL or origin, and a separate Lighthouse laboratory test. Do not confuse them.
Do this:
- Open https://pagespeed.web.dev/ and test an article URL.
- Note whether the Core Web Vitals section uses URL-level field data, origin-level data or has insufficient data.
- Record mobile LCP, INP and CLS if field data exists.
- Open the page in Chrome, press F12 → Performance, enable screenshots if available, and record a reload.
- Find the LCP event or element in the trace. Is it an image, heading or another block?
- Repeat for the homepage and a category page. Different templates may have different bottlenecks.
Interpretation: If LCP is poor but INP is good, start with HTML delivery and the largest visible element. If INP is poor, inspect long JavaScript tasks. If CLS is poor, look for elements changing size or position.
A lab score may vary between runs. Use the same device profile, URL and test conditions for before/after comparisons; then monitor real-user data over time.
2. Find out whether WordPress is slow or the page is heavy
Open DevTools → Network, enable Disable cache (while DevTools is open), reload, and click the first request whose type is document.
Inspect Timing. The Waiting for server response portion is a useful clue, but it is not a pure measure of PHP execution: network and infrastructure effects contribute. Compare multiple requests and regions.
Next, examine response headers for signs of page caching, such as Cache-Control, Age, or a provider-specific cache-status header. There is no universal header name.
Run a second request with normal browser caching and compare. Also test an incognito session (anonymous visitor) and a logged-in session, because page caches commonly bypass authenticated users.
Example: compare document response with curl
From a machine with curl installed:
curl -sS -o /dev/null \
  -w 'HTTP %{http_code}\nDNS %{time_namelookup}s\nConnect %{time_connect}s\nTLS %{time_appconnect}s\nFirst byte %{time_starttransfer}s\nTotal %{time_total}s\n' \
  https://example.com/your-article/
Run it several times. time_starttransfer is time to first byte from the client perspective, not a direct PHP benchmark. A cold cache, CDN location or TLS connection can change the result.
Decision: If anonymous cached requests are quick but uncached requests are consistently slow, investigate WordPress queries, external requests, PHP capacity and hosting. If the document arrives quickly but LCP is late, focus on image discovery, CSS, fonts and rendering.
3. Fix the LCP image with actual HTML
Consider a WordPress article with a 2800-pixel-wide JPEG used as a 900-pixel hero. The browser may download far more bytes than it needs.
WordPress normally generates image sizes and responsive attributes for images rendered through its APIs. Check the rendered HTML, not just the media library, before changing anything.
A good responsive hero can look like this:
<img
  src="/wp-content/uploads/hero-960.webp"
  srcset="/wp-content/uploads/hero-640.webp 640w,
          /wp-content/uploads/hero-960.webp 960w,
          /wp-content/uploads/hero-1440.webp 1440w"
  sizes="(max-width: 700px) 100vw, 960px"
  width="960"
  height="540"
  fetchpriority="high"
  alt="WordPress article displayed on a laptop">
The URLs are examples: the files must exist and the widths must match the actual assets.
What to change in WordPress:
- Open the page in DevTools and inspect the LCP image.
- Check its actual currentSrc in the Console: select the image in Elements, then run
$0.currentSrc. - In Network, check the downloaded image size and whether it is loaded early.
- If the theme hardcodes the original upload URL, update its image output to use WordPress responsive image functions, such as
wp_get_attachment_image(). - Do not lazy-load the image that is likely to be LCP. Use
fetchpriority="high"selectively; avoid assigning it to every image.
Example in a child-theme template when you know the attachment ID:
<?php
echo wp_get_attachment_image(
    $heroImageId,
    'large',
    false,
    [
        'class' => 'article-hero',
        'loading' => 'eager',
        'fetchpriority' => 'high',
        'decoding' => 'async',
    ]
);
WordPress will generate responsive attributes when suitable image metadata and sizes exist. Do not add a second loading attribute manually to markup already produced by core.
Verify: The LCP image starts downloading early, its transferred size is lower where appropriate, and LCP improves in repeat tests. A smaller image alone does not guarantee better LCP if the server or stylesheet remains the bottleneck.
4. Stop loading a plugin's CSS on pages that do not use it
A common problem is site-wide assets from a plugin used on only one page.
For example, a contact form's stylesheet may load on every article. Before removing anything, check the actual registered style handle using wp_styles() or plugin documentation; handles vary by plugin and version.
In a child theme's functions.php or a site-specific plugin, a conditional dequeue may look like:
<?php
add_action('wp_enqueue_scripts', function () {
    if (!is_page('contact')) {
        wp_dequeue_style('example-form-styles');
    }
}, 100);
example-form-styles is a placeholder, not a real plugin handle. Replace it only after verifying the handle in your installation.
This approach is safe only if the form is never embedded elsewhere—for example in a footer, sidebar, popup or reusable block. If it is, a simple is_page('contact') condition is insufficient.
Verification procedure:
- Record the stylesheet's Network request before the change.
- Deploy to staging and reload an ordinary article.
- Confirm the request disappears there.
- Open every page that actually contains the form and submit a test entry.
- Check mobile layouts and console errors.
You can apply the same reasoning to JavaScript, but removing a script without understanding its dependencies can break interactive features.
5. Improve INP: diagnose the long task, then fix the code
INP is not the same as page-load time. It reflects how promptly the page responds to user interactions.
In Chrome DevTools, open Performance, record an interaction such as opening the mobile menu, and inspect the main thread around that interaction. Look for long tasks and repeated style/layout calculations.
Example: an expensive live-search handler
This pattern filters hundreds of items on every keystroke and may repeatedly read and write the DOM:
searchInput.addEventListener('input', () => {
  for (const item of document.querySelectorAll('.result')) {
    item.hidden = !item.textContent.toLowerCase()
      .includes(searchInput.value.toLowerCase());
  }
});
A first improvement is to cache the list and normalized text, then schedule the update rather than repeating DOM queries and text extraction on every event:
const searchInput = document.querySelector('#search');
const results = [...document.querySelectorAll('.result')].map(element => ({
  element,
  text: element.textContent.toLowerCase()
}));

let pendingFrame = 0;

searchInput.addEventListener('input', () => {
  const query = searchInput.value.trim().toLowerCase();

  cancelAnimationFrame(pendingFrame);
  pendingFrame = requestAnimationFrame(() => {
    for (const item of results) {
      item.element.hidden = !item.text.includes(query);
    }
  });
});
This reduces repeated queries and work, but it does not guarantee good INP for thousands of nodes: one large animation-frame callback can still block rendering. For large datasets, paginate, virtualize, move search work off the main thread where appropriate, or process updates in chunks.
Verify: Record the same interaction before and after. Check task duration and perceived response, then monitor field INP.
6. Fix CLS by reserving space for images and embeds
A common layout shift occurs when a video embed loads after the article text and pushes everything below it down.
Reserve its aspect ratio:
<div class="video-frame">
  <iframe
    src="https://www.youtube-nocookie.com/embed/VIDEO_ID"
    title="Video tutorial"
    loading="lazy"
    allowfullscreen></iframe>
</div>
.video-frame {
aspect-ratio: 16 / 9;
width: 100%;
}
.video-frame iframe {
display: block;
width: 100%;
height: 100%;
border: 0;
}Replace VIDEO_ID with a real video ID. For a privacy-conscious site, a click-to-load preview may be preferable to loading the iframe immediately.
Also give images intrinsic width and height or an appropriate CSS aspect-ratio. Reserve space for late-inserted widgets, consent notices and promotional blocks.
Verify: In a Performance recording, inspect layout-shift events and identify the elements that moved. Do not assume the visible moving element caused the shift; an earlier element may have expanded.
7. Understand what each cache actually fixes
A page cache stores generated HTML for eligible requests. An object cache stores reusable application data. A browser cache reuses local static resources. A CDN may cache assets and, depending on configuration, HTML.
They are not interchangeable.
Example: check a public page cache
Request the same public article twice and compare response headers and timings:
curl -sSI https://example.com/your-article/
curl -sSI https://example.com/your-article/
A HEAD request may follow different cache rules than GET; if results are unclear, inspect the actual browser GET request instead.
If the second request is not cached, investigate the site's cache configuration, cookies, response headers and hosting rules. Do not force caching for logged-in users, cart, checkout or personalized account pages.
Example: safe static asset caching
For versioned static assets, a long-lived browser cache can be useful:
Cache-Control: public, max-age=31536000, immutableOnly use such a policy when asset URLs change on updates (for example through content hashes or versioned filenames). Otherwise visitors may retain outdated CSS or JavaScript.
For HTML, use a separate policy appropriate to personalization and your invalidation strategy.
8. Find expensive WordPress database work
If cached anonymous pages are fast but uncached requests are slow, investigate database queries and autoloaded options.
WordPress provides a useful WP-CLI command:
wp option list --autoload=on --fields=option_name,size_bytes \
  --format=table --orderby=size_bytes --order=desc
Important: WP-CLI support for size_bytes and sorting depends on the installed command/version; verify with wp help option list. If unsupported, inspect options with a read-only SQL query or a profiling tool in staging instead.
Do not delete large options just because they are large. Some are essential to active plugins or the theme.
For slow SQL, capture representative requests using a query profiler in staging. Identify the query, its caller and frequency. Typical fixes are reducing repeated queries, correcting application logic or adding an appropriate index after reviewing the schema and query plan.
Avoid enabling verbose database logging on a busy production site without a plan for overhead and sensitive data.

9. Audit WP-Cron without disabling scheduled tasks
On low-traffic sites, WP-Cron events may run late because they are normally triggered by visits. On busy sites, scheduled tasks can also compete with page requests.
Check the scheduled events and whether jobs are overdue. If your hosting supports a reliable system scheduler, you can configure it to invoke WordPress cron regularly.
For example, a server cron job might run:
*/5 * * * * /usr/local/bin/php /path/to/site/wp-cron.php >/dev/null 2>&1The PHP path and site path are examples; adapt them to the server. Only after confirming the external scheduler works should you consider setting:
define('DISABLE_WP_CRON', true);in wp-config.php. Otherwise scheduled publications, cleanup and other jobs may stop running.
This is an operational optimization, not a guaranteed Core Web Vitals improvement.
10. Decide whether hosting is the bottleneck
Hosting is worth revisiting when uncached requests remain consistently slow after obvious application issues are addressed, or when traffic bursts exhaust PHP workers.
Run a controlled comparison:
- Clone the same site to staging environments on two providers.
- Use comparable PHP versions, cache settings and test regions.
- Measure warm-cache and cold-cache requests separately.
- Test anonymous and authenticated requests.
- Observe concurrent-request behavior, errors and resource limits.
- Compare backup/restore, staging, support, CDN features and total cost.
Kinsta is an example of a managed WordPress platform offering managed infrastructure, caching and CDN-related features. It may fit teams that value those services. It should not be called the fastest or best host without a reproducible benchmark against alternatives.
A better host cannot fix a badly loaded hero image or an expensive JavaScript widget. Conversely, optimizing front-end assets cannot compensate for an overloaded origin during uncached traffic.
There is no affiliate link in this article. Any future commercial relationship should be disclosed clearly and should not change the technical evaluation.
11. Before-and-after: how to record meaningful results
Use a simple worksheet:
| Check | Before (illustrative) | After (illustrative) | What changed |
|---|---|---|---|
| Hero transfer size | 1.8 MB | 210 KB | Responsive WebP hero |
| LCP lab result | 4.6 s | 2.8 s | Earlier image discovery and smaller file |
| CLS lab result | 0.18 | 0.04 | Reserved embed space |
| Form CSS on article | 42 KB | 0 KB | Conditional dequeue |
All figures above are hypothetical examples demonstrating how to report changes. They are not benchmark claims, and improvements cannot be attributed to a single change without controlled tests.
Run several measurements, document the environment and inspect the full page after every deployment. Prioritize real-user trends over a one-off synthetic score.
12. A practical 60-minute audit
0–10 minutes: Test three representative URLs in PageSpeed Insights and note available field data.
10–20 minutes: Find the LCP element in DevTools. Inspect currentSrc, transfer size, dimensions and loading priority.
20–30 minutes: Inspect the document request and response headers. Compare anonymous cached and uncached behavior.
30–40 minutes: Sort Network requests by transferred size and inspect scripts/styles loaded on pages that do not need them.
40–50 minutes: Record one slow interaction and inspect long main-thread tasks. Check layout shifts and embed dimensions.
50–60 minutes: Choose one low-risk fix, deploy to staging, verify functionality, then compare repeated measurements.
Do not change five variables at once. Otherwise, even a faster result tells you little about what actually worked.
Frequently asked questions
Should I install another optimization plugin?
Only if it solves a measured problem that your hosting, theme or current tools cannot address cleanly.
Can I improve LCP without changing hosting?
Often, yes. Start by checking the LCP image, server response, render-blocking CSS and resource discovery.
Should I lazy-load all images?
No. The primary above-the-fold LCP image should generally load promptly, not be deferred.
Will a CDN fix slow database queries?
Not for requests that still reach WordPress uncached. A CDN can reduce origin traffic and accelerate eligible cached responses.
How do I know a fix worked?
Compare the same URLs under similar conditions, repeat lab tests, verify functionality and monitor field Core Web Vitals over time.
Conclusion
A slow WordPress site needs a diagnosis, not another collection of plugins. Start with field data, identify the LCP element, separate origin delays from front-end delays, and make changes you can verify.
The most valuable improvements are often surprisingly concrete: one correctly sized hero image, one unnecessary stylesheet removed, one expensive interaction simplified, or one misconfigured cache fixed.
Hosting matters too—but only a controlled comparison can tell you when it is the limiting factor.